

Season so far plot

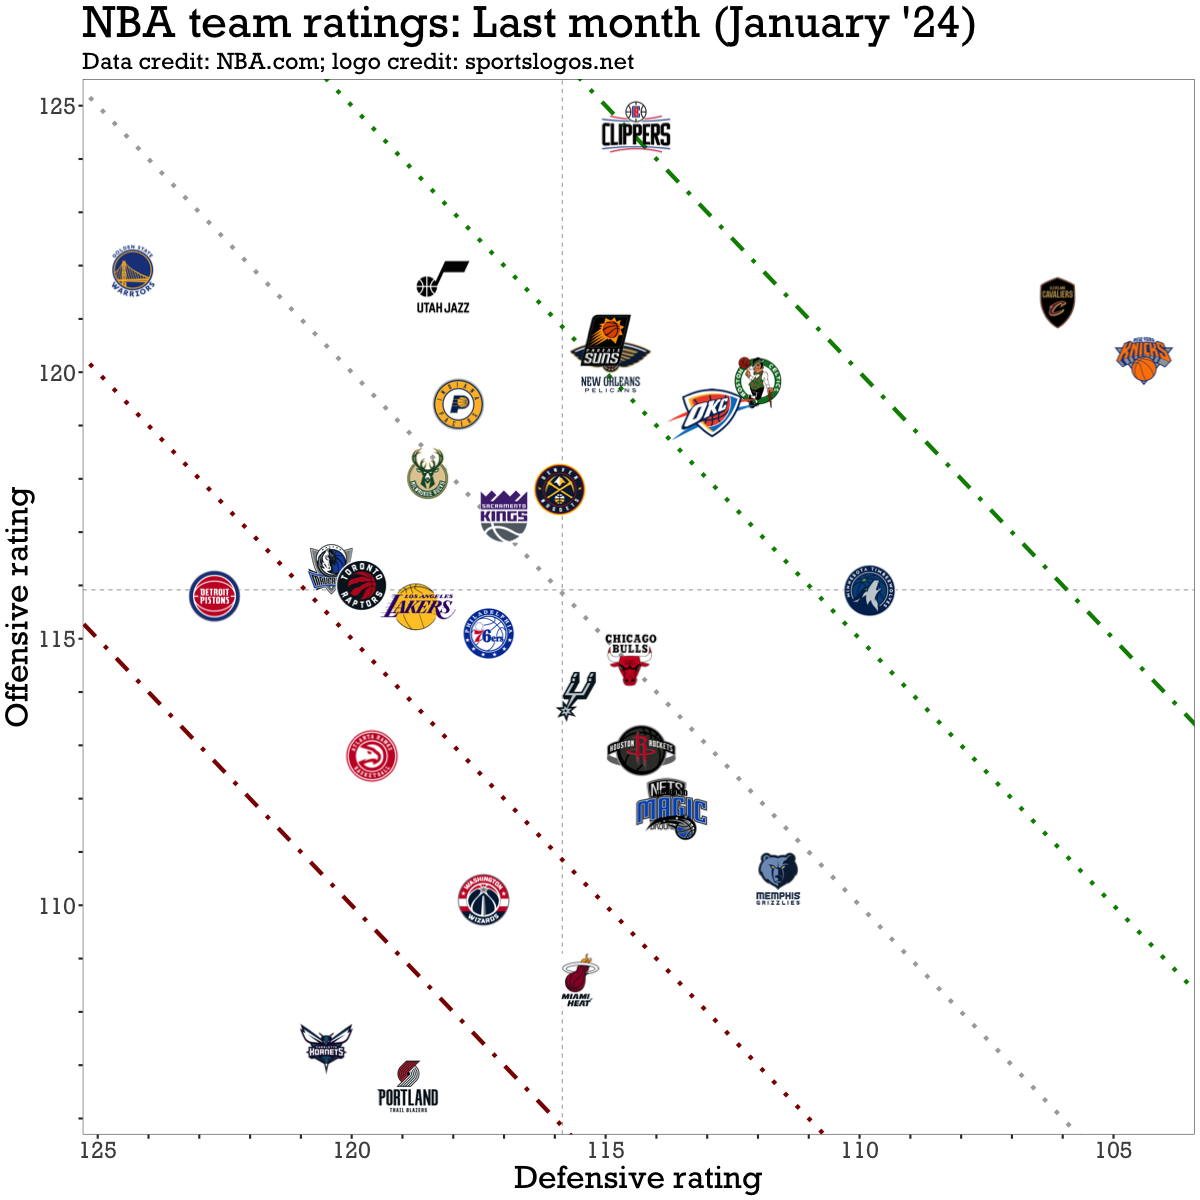
Overplotting: On the last month plot, the Suns and Pelicans are sharing a spot, as are the Magic and Nets. The Warriors and Mavericks are sharing a spot on the season so far plot.
New data source: For this post - and probably going forward - I switched from using Basketball-Reference.com data to NBA.com data. NBA.com provides many more filters for the team advanced stats tables than BR, which enabled me to create the last month plot. There are small differences between the NBA.com and BR data, which I think is because NBA.com doesn’t count In-Season Tournament as regular season games but BR does.
Previous edition: Team offensive and defensive ratings (Dec 31, '23)
Plot explanation
Offensive and defensive ratings are the estimated number of points teams score and allow per 100 possessions. Horizontal and vertical lines are league averages. Diagonal bands reflect net ratings, which are offensive ratings minus defensive ratings. The green dot-dash line is a net rating of +10, green dotted +5, red dotted -5, and red dot-dash -10).
That warriors defensive rating yikes only confirms my eyeball test that opponents get such incredibly easy buckets against them.