
Hello all and Happy Thanksgiving!
A few people have asked how the server is doing and I’ve been meaning to post some metrics for a while.
We’re running on a “Advance-1 Gen 2” server with OVH hosted in Beauharnois, Quebec. This is a 6 core xeon 2386G with 32gb of ram and 2x 512gb nvme ssd’s (raid 1). It’s also ended up being pretty overkill for what we need so we may want to consider downgrading in the future, but it’s relatively inexpensive ($130/mo) for what it is.
We store image uploads on OVH Object Storage, consuming about 430gb.
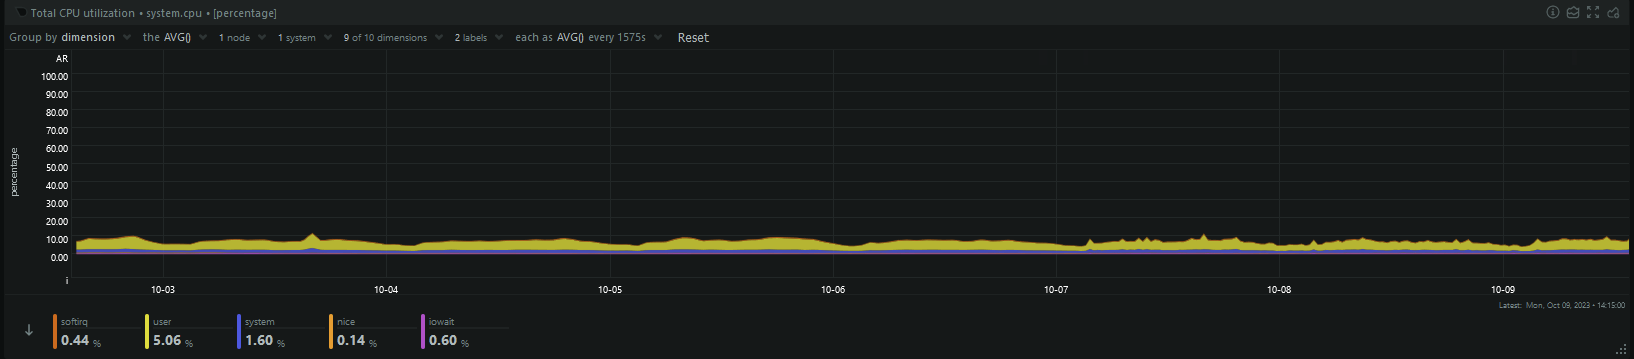
CPU peaks at barely 10%:
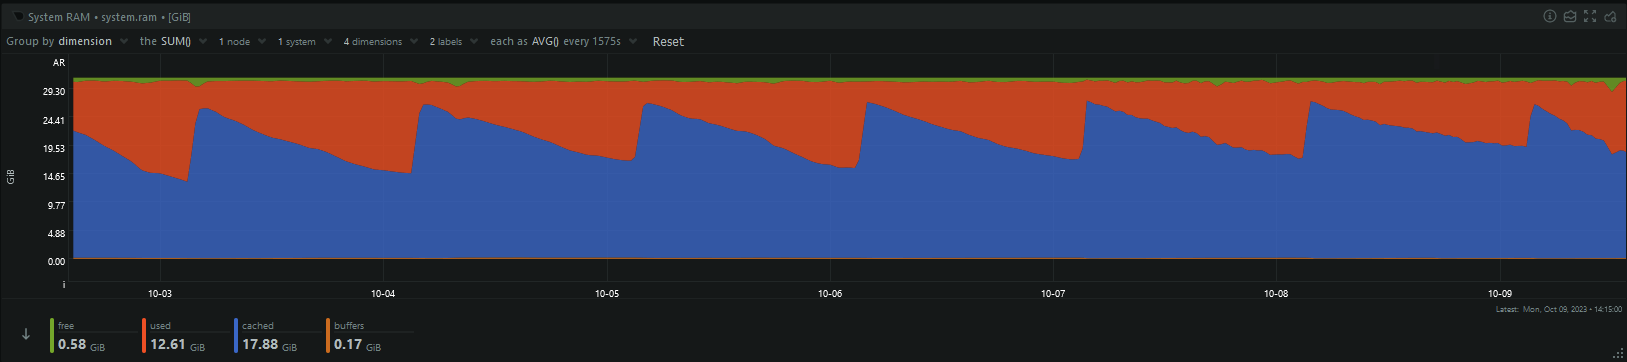
Similarly most of our RAM just gets used for filesystem caching. The pattern you see is due to a cronjob I have in place that restarts lemmy each night at 3am PT, since it seems to leak memory for us.
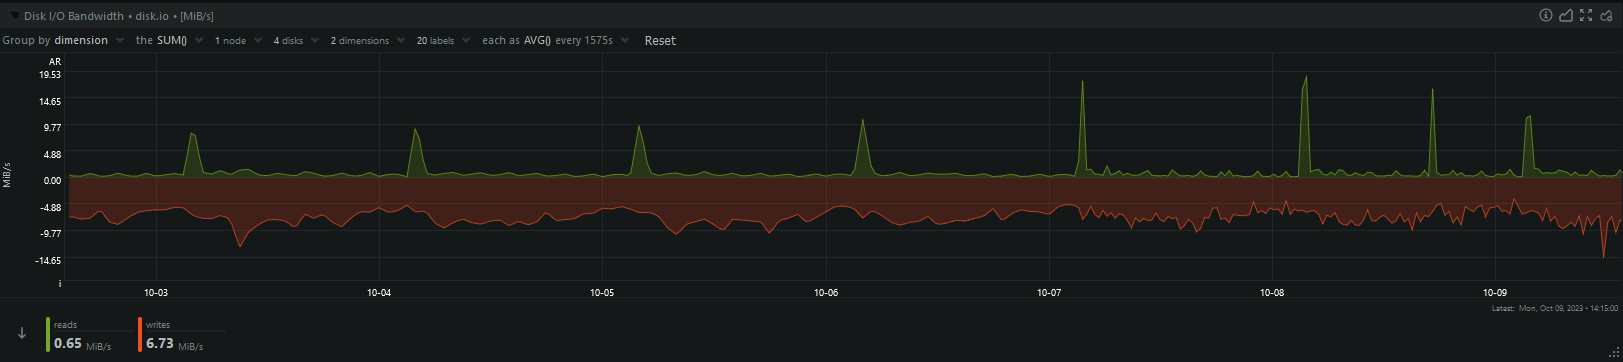
A few weeks ago we migrated our pict-rs over to OVH’s object storage platform, so our disk needs are pretty minimal.

and with postgres basically just keeping the working DB in memory, disk IO is mostly just writes:
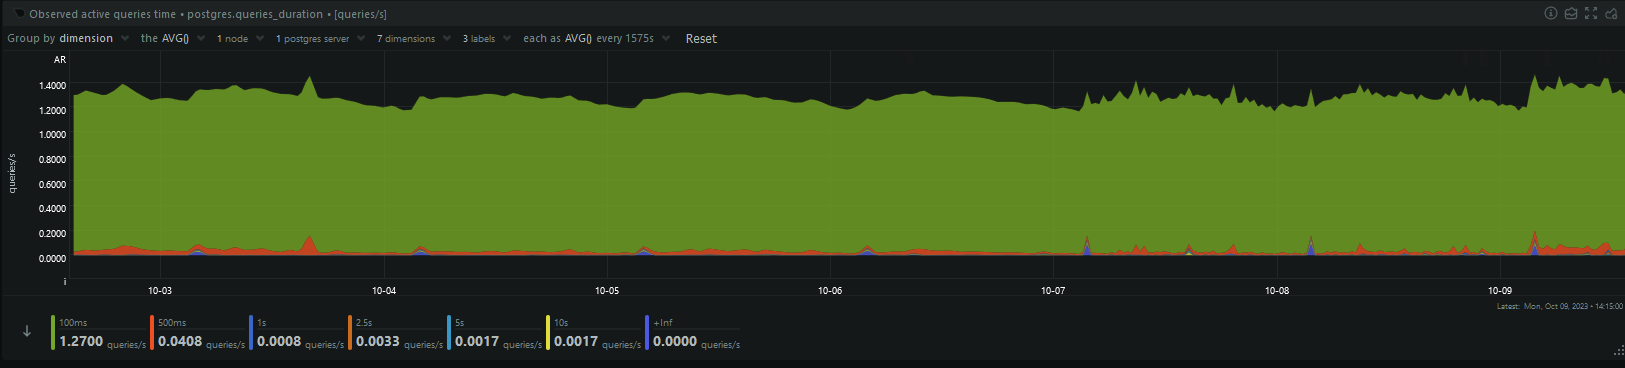
Database throughput shows some interesting activity happening for the past few days, but I just noticed and haven’t dug into who/what might be causing this.
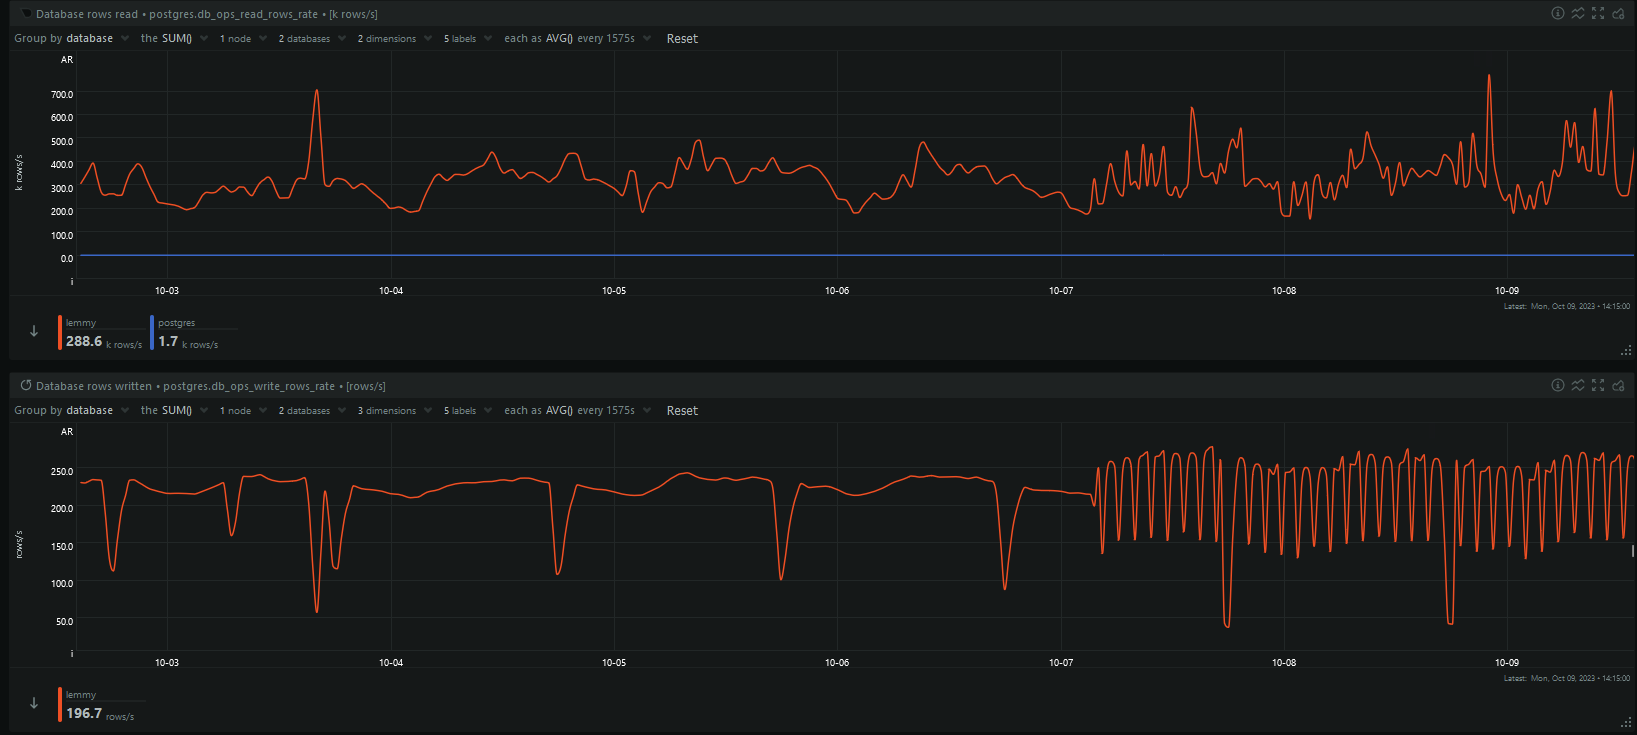
but still performance is fine with most queries returning in under 100ms
Lemmy tends to return 4xx errors hence the high error rates from nginx:

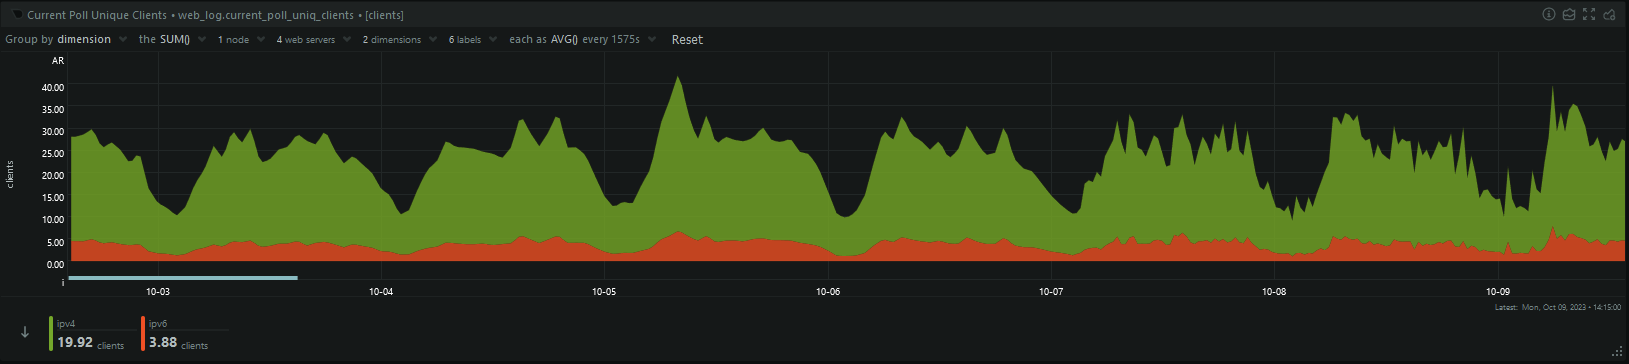
Most of our traffic is still ipv4:
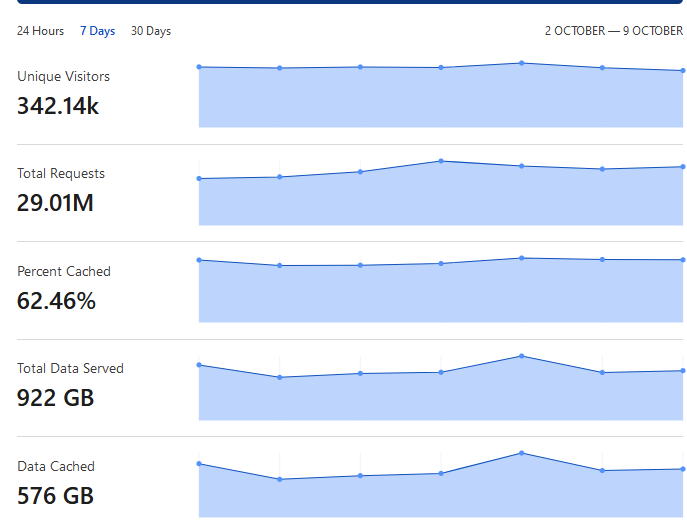
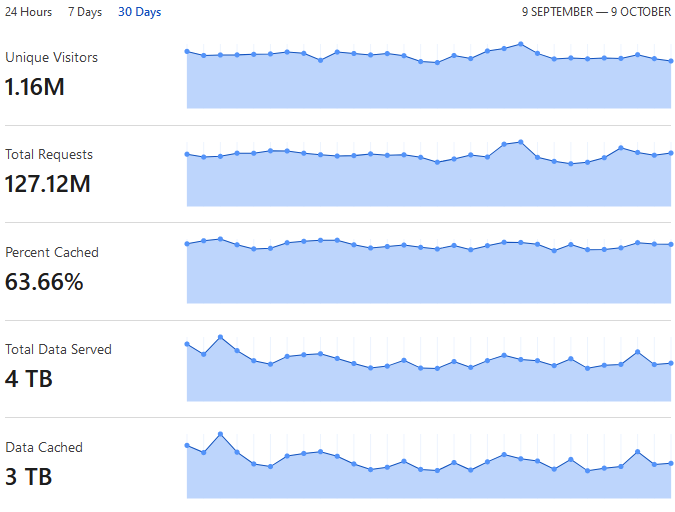
Lastly, we use cloudflare as a caching proxy and ddos protection layer in front of our server. They absorb about 64% of our bandwidth usage:
Let me know if there’s anything else you’re curious about!
Honestly, me too.