
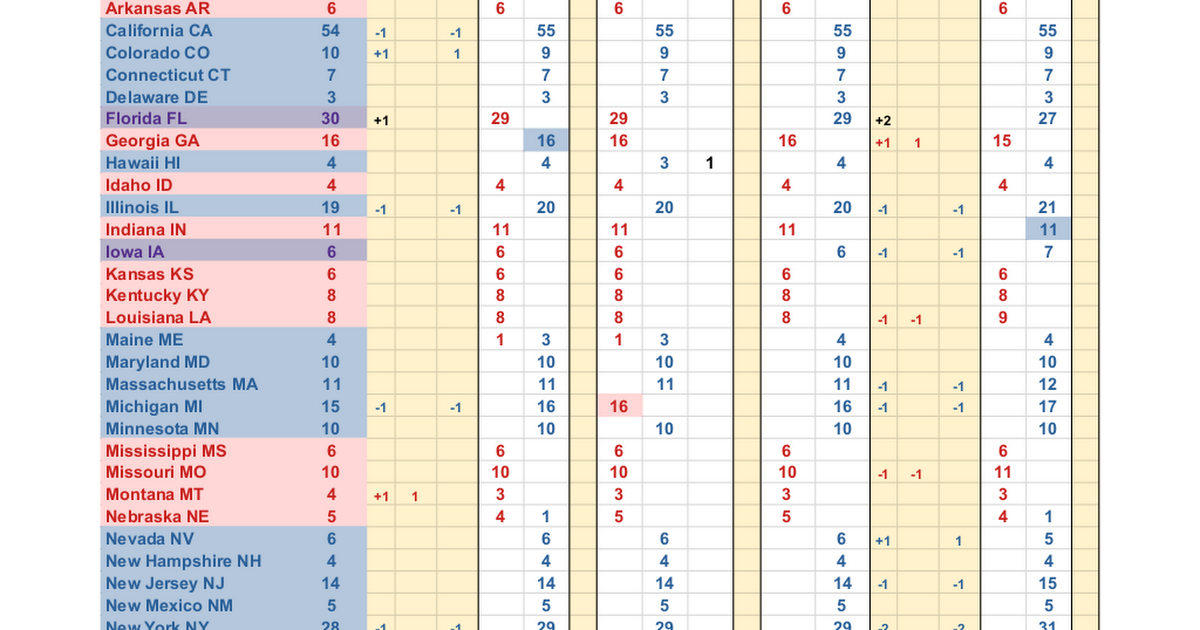
After noticing the electoral votes changed for this election from the last in 2020, I counted the change in differences of republican states and democratic states, ignoring the swing states. I noticed republican states gained more votes this time than last, and democratic states lost votes, overall giving republicans more electoral votes for this election. Then I kept on going all the way back to almost the civil war. To me, it seems the electoral college has been favoring red states from 1968 to present time. I want to post this somewhere to get feedback if there is a legit trend (red/right leaning) or I have missed something or anything else.
I tried to color the sheets so they are not too hard to read and understand. I also color coded conservative party as red, and liberal party as blue. There was a party shift between 1960 and 1980, probably having 1971 as the inflection point (WTF happened in 1971?). It was interesting to see some states stay mostly their colors from the remnants of the civil war to present day. You should be able to download the document, if you want.
Also, should I also send this to my representative or would that be pointless, or fruitless?
I forgot to add: In determining if the state was red or blue at a change point, I looked at the 4 prior election results, and 2 aft election results, 6 total to determine how red, blue, or tied purple it was for that time. It’s the only fudge factor that could be modified because it’s just a guess, but I think the trend will remain even if you modify this (Ex: 3 prior, 1 aft, 2 prior, 1 Aft, etc.)