Compiling this data was not as hard as I expected, let’s go through the data and the shiny graphs!
Age of Beeple
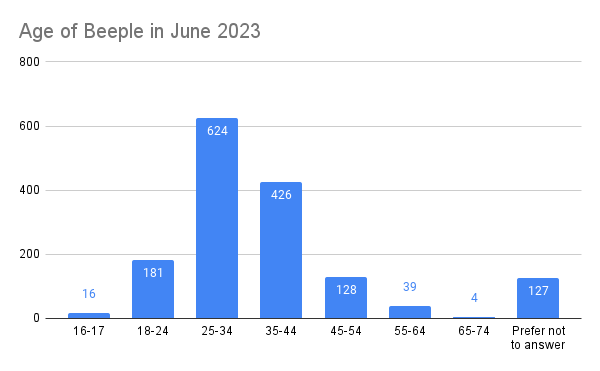
Most are above 24! Seems we got an older average age compared to a lot of social media. It would be interesting to see how many came here with experiences from independent forums before Reddit.
Where Beeple reside

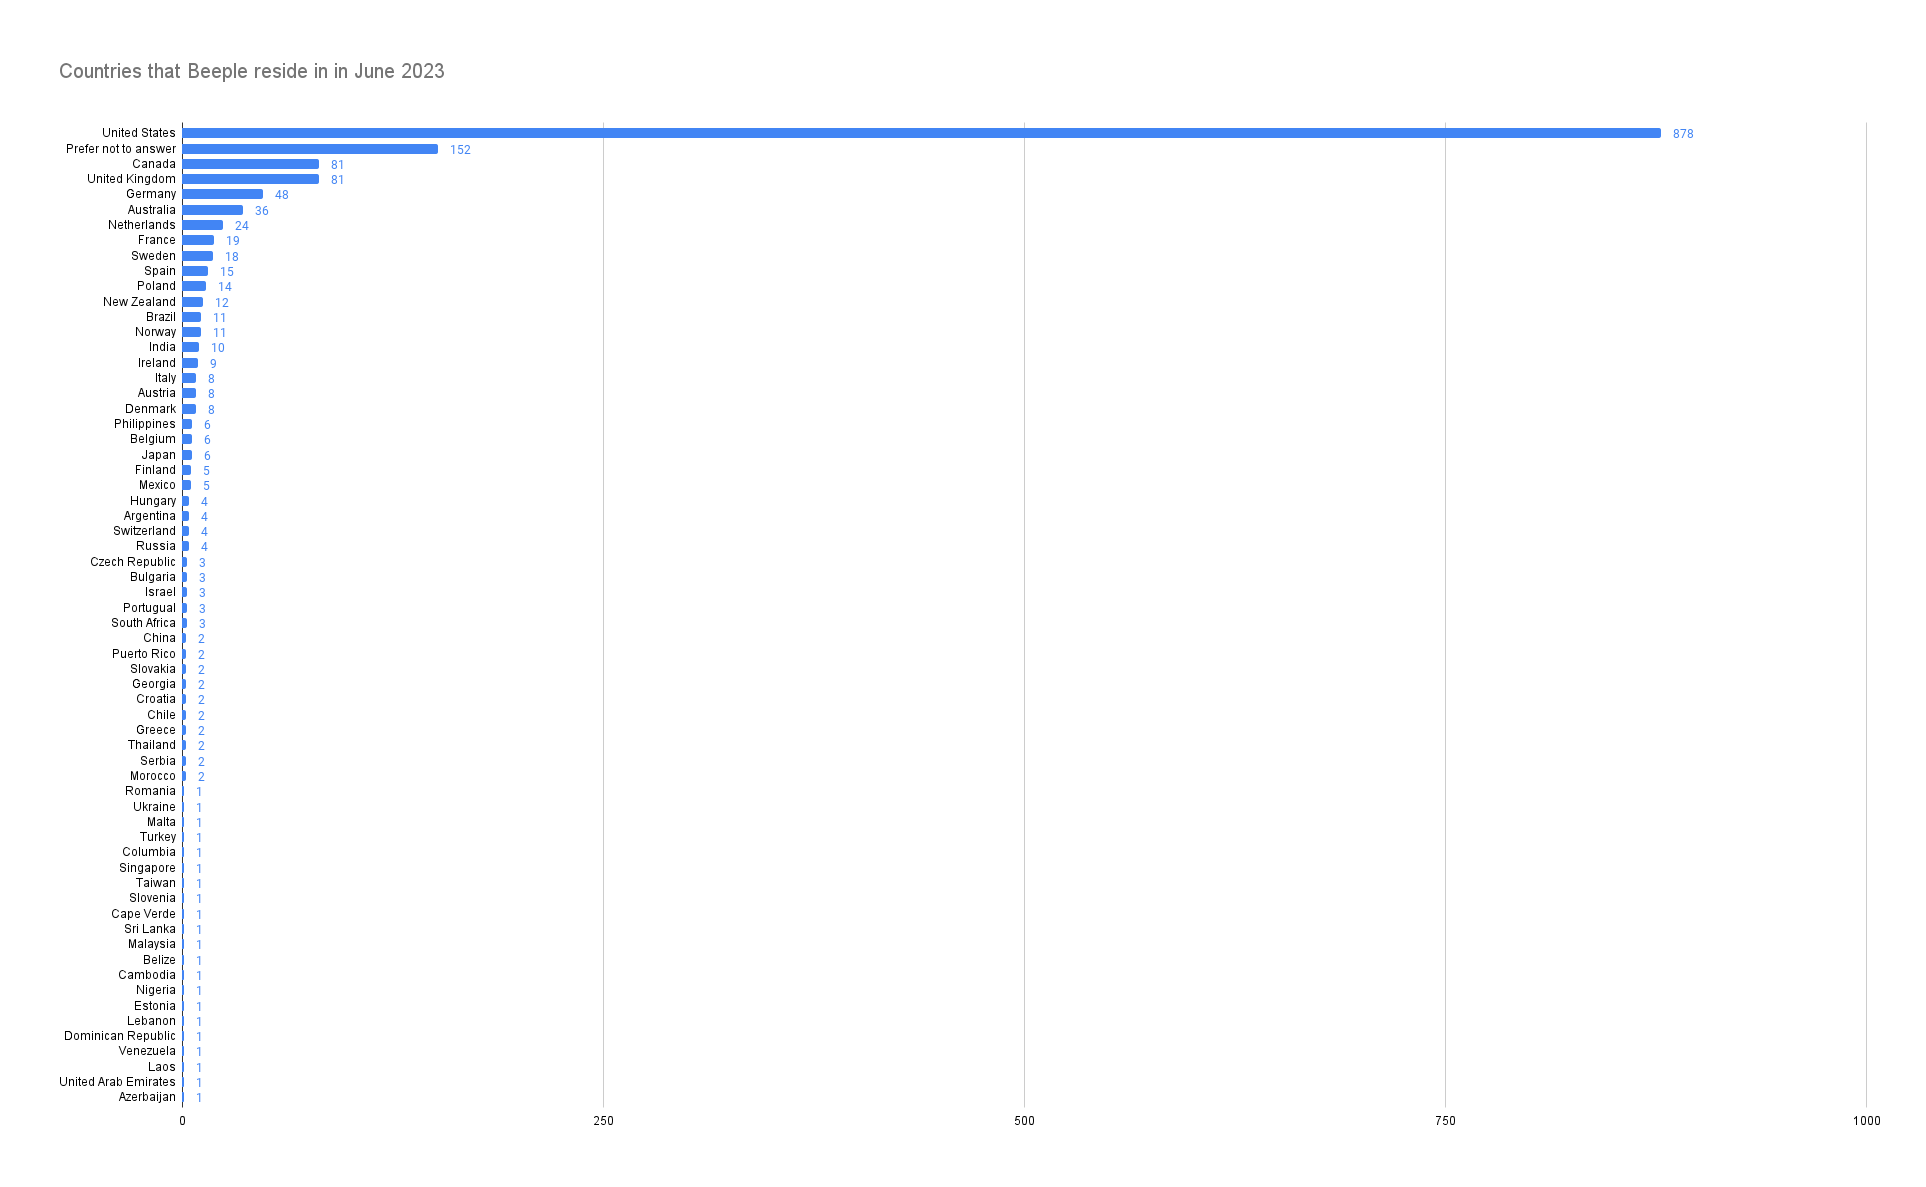
This one’s a big graph. Though we can notice most people are from the US. Would be nice to see more countries represented though a big part of it likely has to do with language. (You will need to open the big graph in another tab, it’s too big to show properly.)
Gender identity of Beeple

So, as expected, mostly men. However, less than expected which is nice to see. There should be outreach to at least equalize this.
Sexual orientation of Beeple
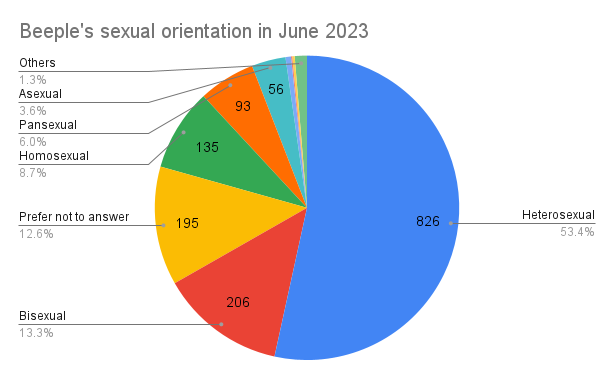
This is kinda surprising. It seems we managed to get a lot more LGBTQ+ people than expected considering most of you all come from Reddit - so this is nice to see. This is most likely because of our focus on a safe space.
Whiteness of Beeple
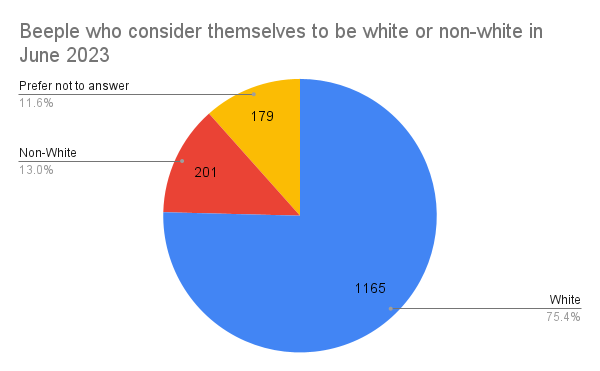
As expected, mostly white which is unfortunate. I think there’s outreach to be done in that regard as well.
Neurodivergence of Beeple

We seem to have a really surprising amount of neurodivergent people! Definitely nice to see.
Beeple with disabilities

I… have no idea how to interpret this data so I’ll just say, shiny graph.
Beeple’s awareness of the Fediverse
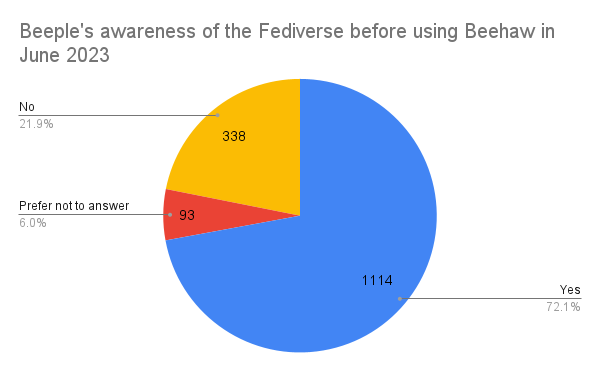
Most knew about the fediverse but still a good 20% had not heard about it so glad to see you all managed to find your way here!
How Beeple have been dealing with Beehaw
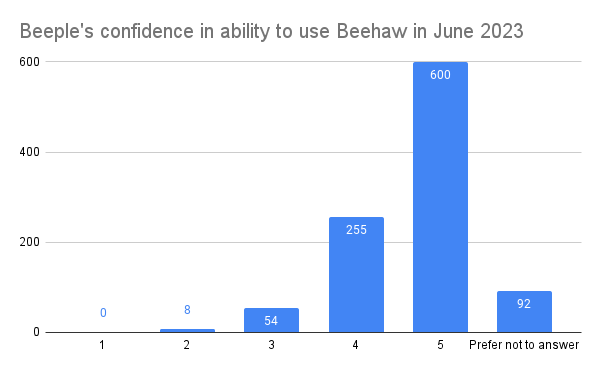
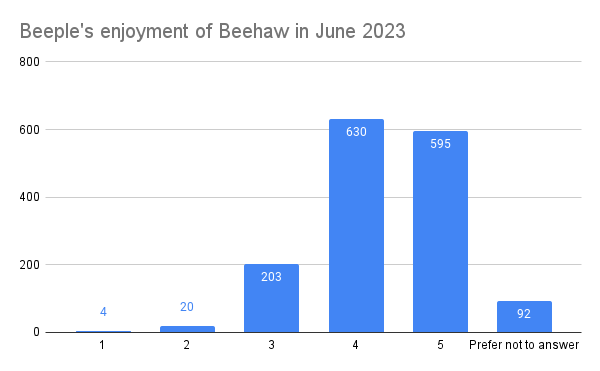
It seems most people feel relatively confident in their ability to use Beehaw and most people seem to enjoy it. That makes me really happy to see. Feels rewarding, feels good.
Conclusion
I wanna thank everyone for the feedback about the survey and its questions - we’ll do better next time! I’m glad we did this survey because it shows the areas to work on in terms of outreach! Thank you all for your participation!


I understand, I’m a white cis man and I used to feel this way sometimes when reading things like this, but my perspective has since changed.
The way I see it, Beehaw is actively trying to be an inclusive space, as opposed to a lot of other online spaces which really aren’t so inclusive.
My expectation would be that, naturally, POC, women, and lgbtq+ people would hang out more in inclusive spaces than non-inclusive ones, while non-minorities may be evenly spread of even favor non-inclusive spaces. Therefore, I would expect demographics of inclusive spaces to have an overall significantly smaller percentage of non-minorities.
However, some of these numbers look relatively close to national demographics (at-least based on those I see on Wikipedia for the US), and may even have a smaller percentage of minorities than national average. I don’t know much about statistics and I’m not a mathematician, there’s probably all sorts of factors going into why those numbers are the way they are. Still, instinctively, those numbers look unfortunate to me, since they don’t reflect my expectations of a successfully inclusive community.
I hope nobody feels left out.