
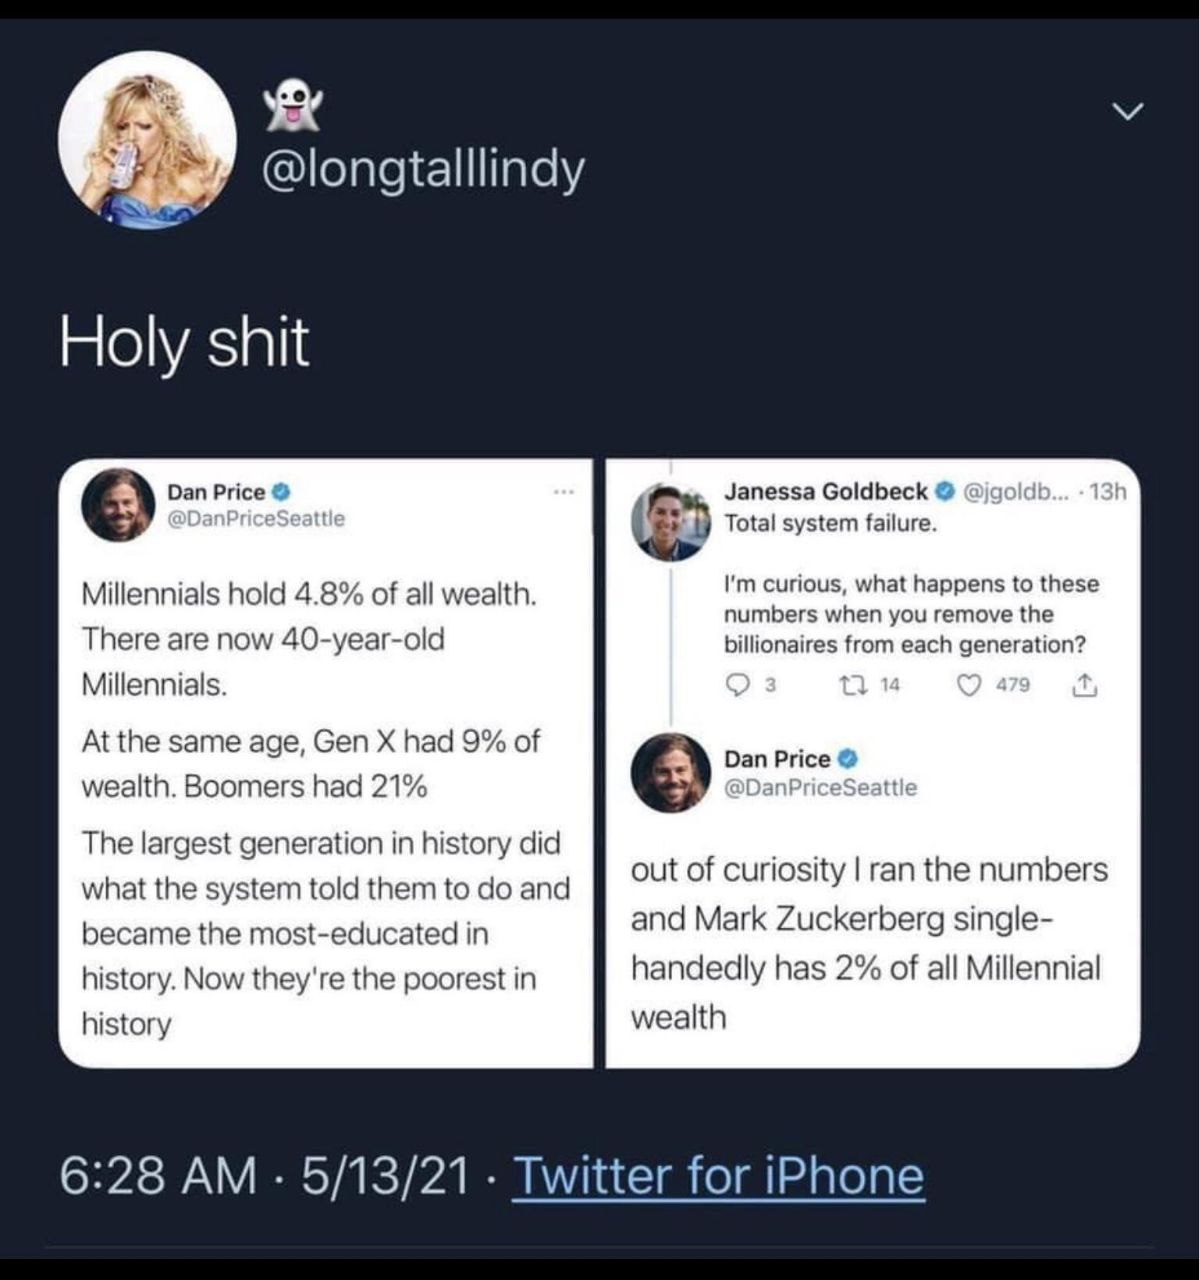
For comparison, Gen X had 9% of the wealth, and Boomers had 21%. The largest generation in history did everything they were told, became the most educated generation, and now they’re the poorest.
Here are the official numbers from the fed for millennial wealth
Zuckerburg owns a very large amount of Facebook stock, and he sells it on a pre-determined, fixed, schedule. The current amount of stock he has is around $80 billion.
To find out how much he’s sold on what schedule, the easiest answer is Yahoo Meta, insider transactions: https://finance.yahoo.com/quote/META/insider-transactions?p=META
You can also look at the their 2022 proxy report official in Meta SEC filings https://www.sec.gov/Archives/edgar/data/1326801/000132680122000043/meta2022definitiveproxysta.htm
Zuckerburg has 93,675,733 vested shares, 831,706 class A shares, and 349,745,790 class B shares a total of 350,577,496 shares (we don’t care about voting rights, just valuation). At today’s market value, those shares are worth $296.73 each (October 30, 2023). We multiple those numbers together and get $104,026,860,388.08.
So, that rounds to $104 billion dollars in Meta stock.
Finally, he controls additional shares via Chan Zuckerberg foundation, Mark Zuckerberg Trust, and assorted other groups.
Reference your questions about relative percentages of the population etc., I had a whole big ass post with references but I lost it. I’m not doing all that again so I’ll just give the main takeaways from memory and the history in my calculator so unfortunately my source is trust me bro.
Two caveats: I’m using median ages of the cohorts, average could charge things (edit: see correction at end). Percentages are of total population including children (who generally have no wealth), not working age plus retired population.
In 1990 the median boomer was 35, they represented 30.6% of the population and had 21.5% of the wealth.
In 2022 the median millennial was 33.5, they represented 21.7% of the population and had 5.6% of the wealth.
So boomers had 1.4x the share of the population but 3.8x the share of the wealth.
Boomers in 1990 did have 1.5 more years to earn, save, and grow their wealth than millennials in 2022(maybe more or less if you use average age), but I don’t see how that alone makes the difference. For whatever combination of reasons, boomers had a much larger share of the wealth, relative to their population share, in their mid thirties than millennials do.
Correction: 35 and 33.5 aren’t median ages, that’s just the age of the middle of the cohort. The point about using average (or even the real median) age for an apples-to-apples comparison stands, I just misused the word median.
Thank you for that! At least that proves something that actually makes sense!