Credit: /u/Anabiotic on Reddit
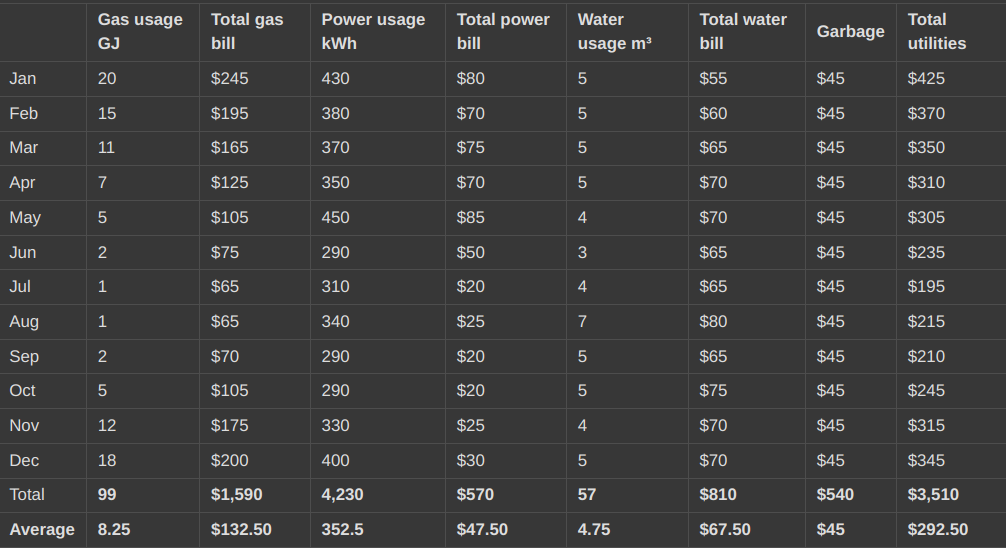
One of the most common questions on /r/edmonton is about utility costs, either by those moving to the city or those wanting to compare their usage/costs with others. As one comprehensive data point, below was my usage and costs for the 2022 calendar year. I have specific comments below the table as context.
On average my utilities were just under $300/month for 2022.
Methodology:
- All monthly $ figures are rounded to the nearest $5
- Gas usage rounded to the nearest GJ, power usage rounded to the nearest 10 kWh, water is rounded to the nearest m³
- Bills crossing over two months are time-weighted across both months - i.e. the below represents the calendar months of the usage, not the month it was billed (this is not exactly accurate but a good approximation)

Gas comments
- Upgraded attic and basement header insulation over the summer
- Mid-efficiency furnace (~80%)
- Inefficient 50-gallon gas-fired hot water tank
- $3.79/GJ fixed rate until November, then $4.99/GJ. Consumer carbon tax increased April 1.
- Temp settings low, 16°C overnight, 17-18°C during the day
- Attic insulation is R60; walls are R20
- House is ~2,000 square feet with an inefficient layout (e.g. high ceilings)
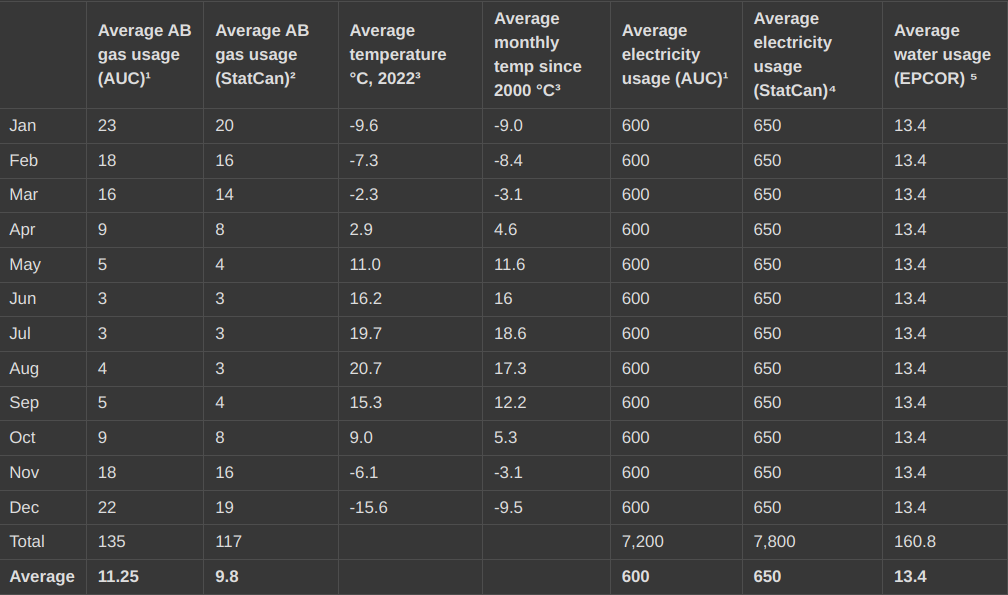
- December was much colder than usual, while September was much warmer than usual - see next table for details
Power comments
- 2-person household
- Total AB government rebates of $300 received over the year, starting in July (same as every customer with a site ID)
- $0.06/kWh fixed power rate until July, then $0.08/kWh rate
- Have A/C, but rarely run it
Water comments
- 2-person household, large lot (stormwater is based on lot size)
Garbage comments
- The city has two bin sizes; I have the smaller one
More info on the year and averages for those who are curious - this can help you see where you stack up. Numbers from different sources are slightly different.

¹Per Alberta Utilities Commission - note: AUC does not give a monthly shape for power, but usage will actually be higher in the winter and lower in the spring/fall rather than flat as shown here.
² StatCan Household Energy and the Environment 2019 survey for detached houses (applied AUC monthly shape for gas).
³ https://edmonton.weatherstats.ca/download.html
⁴ StatCan Household Energy and the Environment 2019 survey for detached houses (converted from GJs to kWh - no monthly data available, but will actually be higher in the winter and lower in the spring/fall rather than flat as shown here)
⁵ Page 25 of EPCOR’s PBR reader’s guide

