Questions:
- Can you test 450V high ripple current caps with a any old desktop RCL meter?
- Has digikey shipped me faulty units?
Background:
I’ve gotten a couple of 660uF (not a typo, it’s some weird high ripple current caps for an outdoor AC unit) 450V caps to replace some that I decided were duds. Normally I only measure components when troubleshooting, but this being 20USD with vat devices I thought “what the heck, I better”.
The caps in question are chemi-con EKHJ451VSN661MA59M https://www.digikey.dk/en/products/detail/chemi-con/EKHJ451VSN661MA59M/17728502.
Method:
I’m using a Phillips PM6303A, which is a 1kHz RCL meter. Ambiant temp is approx 15°C. The caps have a 20% tolerance, so capacity should be >528uF, but when measuring both caps settle at approx 450uF after a little while. After 16hours it hasn’t deviated for the one cap I’ve left in over night. The dissipation factor, tan(δ), settled at 0.57, while the datasheet states that it shall be no greater than 0.2.
For comparison, the caps I thought was faulty, have been running for about 20years, with the same specs, but came out to 550uF and 0.3, and as the spec said 0.2 I decided to change them.
Can you run and plot a frequency sweep?
Well I guess, I’ve got a sweeping function gen and a 4ch DSO… I’m gonna look into that and get back.
Caveat: my engineering diploma in embedded electronics is 10 years old, and it’s been awhile since I’ve done more than just the odd solder job. So it’s going to take a little while.
@[email protected] when you say “plot a frequency sweep” what you’re looking for is just the usual voltage/time graph from a scope? No resistance in parallel to the capacitor for discharge? No fixed resistance in series? No x/y graphing funny business?
Or are you looking for a bode plot? I was hesitant in my first response because I thought I remembered Dave doing a bode plot with a sweeping gen and a scope, but I wasn’t sure if I could find it. I could https://m.youtube.com/watch?v=uMH2hGvqhlE
I think I’ve managed to do what you asked, let me know if I messed it up.
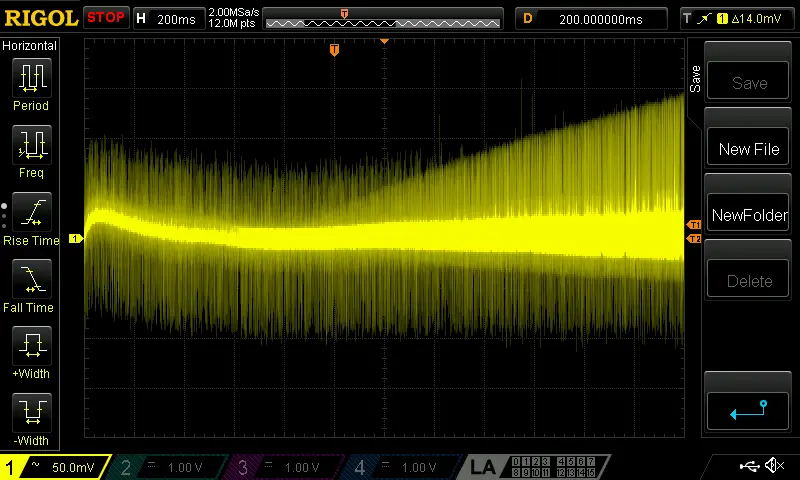
I got my function gen to do 6.1-12 in two decades x100 and x1000. The sweeps are almost linear after the first 500ms, meaning that each horizontal division of each 200ms denotes the following:
Timemark Frequency 0 6.1kHz 200ms 6.1kHz 400ms 6.1kHz 600ms 10.2kHz 800ms 22.7kHz 1000ms 36.2kHz 1200ms 50kHz 1400ms 64.1kHz 1600ms 78.1kHz 1800ms 92.6k 2000ms 106kHz 2200ms 119kHz With all that said here’s the data
Replacement cap 610-12k
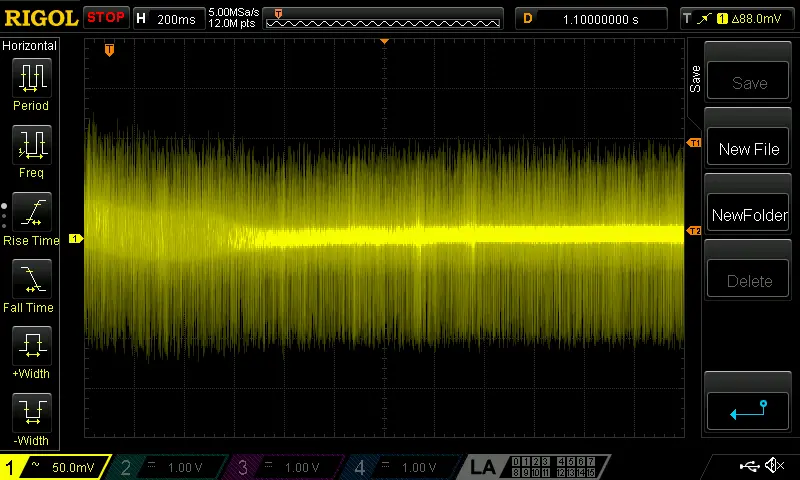
Original cap 610-12k

Replacement cap 6.1k-120k
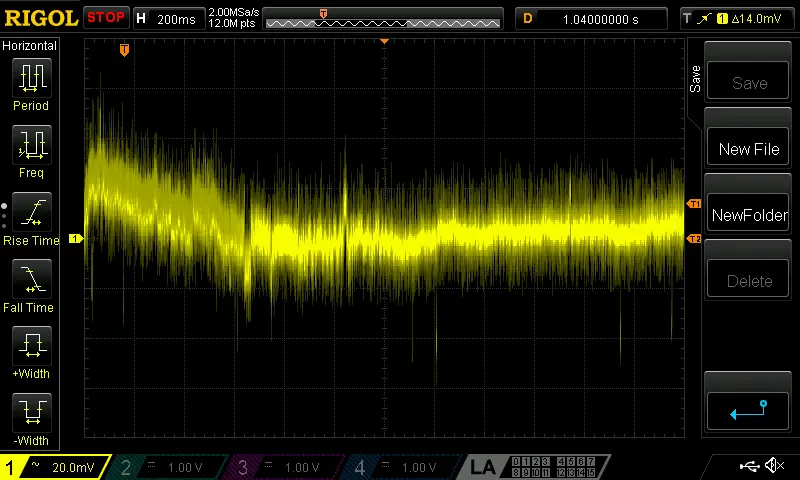
Original cap 6.1k-120k