
… at least in the northern hemisphere. :-)
I picked a representative city for North America (Salt Lake City) to illustrate the seasonal patterns for our solar harvest. The modeling is done in PVwatts. The kWh/m2/day figure is the same, mathematically, as Hours of Full Sun Equivalent since “sunlight” under standard test conditions are defined as 1000w/m2.
using the numbers
We can roughly model average harvest from unshaded, flat-mounted panels on MPPT like this:
rated array wattage x FSW x 0.85
So a 400w setup in SLC in August would average 2.285kWh/day if charging/loads demanded it.
Note: the 0.85 constant above represents overall system efficiency after various losses (cell temp derating, wiring losses, bucking losses, etc). If you know how your particular system behaves then plug in your actual number. Mine is quite close to 85% so I use that common default.
effect on snowbirds
Although summer harvest in SLC is 4.5x the winter harvest, snowbirds tend to go south in the winter. In my experience this makes the summer v. winter harvest ratio more like 2:1.
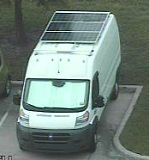
I’ve got a 750W setup and can confirm it’s been declining for the past month or so, just as it does every year around this time. It’s still going strong compared to what it does during the winter though, which is nearly nothing at my latitude! :)
Same, 750w. I “cheat” the latitude issue by following mild weather, which takes me further south in he winter. :-)
